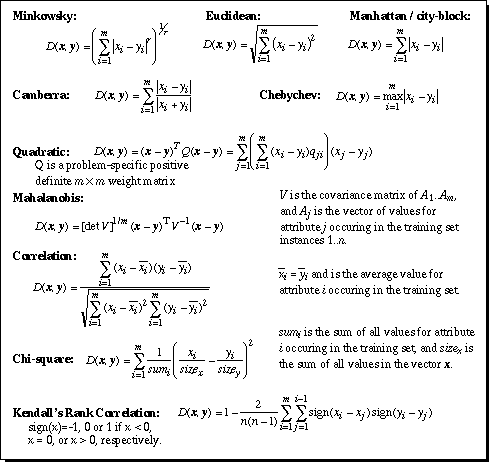
Figure 1. Equations of selected distance functions. x and y are vectors of m attribute values.
As mentioned in the introduction, there are many learning systems that depend upon a good distance function to be successful. A variety of distance functions are available for such uses, including the Minkowsky (Batchelor, 1978), Mahalanobis (Nadler & Smith, 1993), Camberra, Chebychev, Quadratic, Correlation, and Chi-square distance metrics (Michalski, Stepp & Diday, 1981; Diday, 1974); the Context-Similarity measure (Biberman, 1994); the Contrast Model (Tversky, 1977); hyperrectangle distance functions (Salzberg, 1991; Domingos, 1995) and others. Several of these functions are defined in Figure 1.
Figure 1. Equations of selected distance functions. x and y are vectors of m attribute values.
Although there have been many distance functions proposed, by far the most commonly used is the Euclidean Distance function, which is defined as:
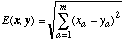 (1)
(1)where x and y are two input vectors (one typically being from a stored instance, and the other an input vector to be classified) and m is the number of input variables (attributes) in the application. The square root is often not computed in practice, because the closest instance(s) will still be the closest, regardless of whether the square root is taken.
An alternative function, the city-block or Manhattan distance function, requires less computation and is defined as:
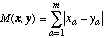 (2)
(2)The Euclidean and Manhattan distance functions are equivalent to the Minkowskian r-distance function (Batchelor, 1978) with r = 2 and 1, respectively.
One weakness of the basic Euclidean distance function is that if one of the input attributes has a relatively large range, then it can overpower the other attributes. For example, if an application has just two attributes, A and B, and A can have values from 1 to 1000, and B has values only from 1 to 10, then B's influence on the distance function will usually be overpowered by A's influence. Therefore, distances are often normalized by dividing the distance for each attribute by the range (i.e., maximum-minimum) of that attribute, so that the distance for each attribute is in the approximate range 0..1. In order to avoid outliers, it is also common to divide by the standard deviation instead of range, or to "trim" the range by removing the highest and lowest few percent (e.g., 5%) of the data from consideration in defining the range. It is also possible to map any value outside this range to the minimum or maximum value to avoid normalized values outside the range 0..1. Domain knowledge can often be used to decide which method is most appropriate.
Related to the idea of normalization is that of using attribute weights and other weighting schemes. Many learning systems that use distance functions incorporate various weighting schemes into their distance calculations (Wettschereck, Aha & Mohri, 1995; Atkeson, Moore & Schaal, 1996). The improvements presented in this paper are independent of such schemes, and most of the various weighting schemes (as well as other enhancements such as instance pruning techniques) can be used in conjunction with the new distance functions presented here.
None of the distance functions shown in Figure 1, including Euclidean distance, appropriately handle non-continuous input attributes.
An attribute can be linear or nominal, and a linear attribute can be continuous or discrete. A continuous (or continuously-valued) attribute uses real values, such as the mass of a planet or the velocity of an object. A linear discrete (or integer) attribute can have only a discrete set of linear values, such as number of children.
It can be argued that any value stored in a computer is discrete at some level. The reason continuous attributes are treated differently is that they can have so many different values that each value may appear only rarely (perhaps only once in a particular application). This causes problems for algorithms such as VDM (described in Section 2.4) that depend on testing two values for equality, because two continuous values will rarely be equal, though they may be quite close to each other.
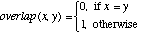
A nominal (or symbolic) attribute is a discrete attribute whose values are not necessarily in any linear order. For example, a variable representing color might have values such as red, green, blue, brown, black and white, which could be represented by the integers 1 through 6, respectively. Using a linear distance measurement such as (1) or (2) on such values makes little sense in this case.
One way to handle applications with both continuous and nominal attributes is to use a heterogeneous distance function that uses different attribute distance functions on different kinds of attributes. One approach that has been used is to use the overlap metric for nominal attributes and normalized Euclidean distance for linear attributes.
For the purposes of comparison during testing, we define a heterogeneous distance function that is similar to that used by IB1, IB2 and IB3 (Aha, Kibler & Albert, 1991; Aha, 1992) as well as that used by Giraud-Carrier & Martinez (1995). This function defines the distance between two values x and y of a given attribute a as:
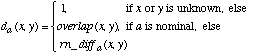 (3)
(3)
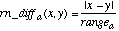
Unknown attribute values are handled by returning an attribute distance of 1 (i.e., a maximal distance) if either of the attribute values is unknown. The function overlap and the range-normalized difference rn_diff are defined as:
 (4)
(4)
 (5)
(5)The value rangea is used to normalize the attributes, and is defined as:
where maxa and mina are the maximum and minimum values, respectively, observed in the training set for attribute a. This means that it is possible for a new input vector to have a value outside this range and produce a difference value greater than one. However, such cases are rare, and when they do occur, a large difference may be acceptable anyway. The normalization serves to scale the attribute down to the point where differences are almost always less than one.
The above definition for da returns a value which is (typically) in the range 0..1, whether the attribute is nominal or linear. The overall distance between two (possibly heterogeneous) input vectors x and y is given by the Heterogeneous Euclidean-Overlap Metric function HEOM(x,y):
 (7)
(7)This distance function removes the effects of the arbitrary ordering of nominal values, but its overly simplistic approach to handling nominal attributes fails to make use of additional information provided by nominal attribute values that can aid in generalization.
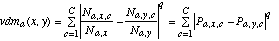
The Value Difference Metric (VDM) was introduced by Stanfill and Waltz (1986) to provide an appropriate distance function for nominal attributes. A simplified version of the VDM (without the weighting schemes) defines the distance between two values x and y of an attribute a as:
 (8)
(8)where
 (9)
(9)where Na,x is the sum of Na,x,c over all classes, i.e.,
 (10)
(10)and the sum of Pa,x,c over all C classes is 1 for a fixed value of a and x.
Using the distance measure vdma(x,y), two values are considered to be closer if they have more similar classifications (i.e., more similar correlations with the output classes), regardless of what order the values may be given in. In fact, linear discrete attributes can have their values remapped randomly without changing the resultant distance measurements.
For example, if an attribute color has three values red, green and blue, and the application is to identify whether or not an object is an apple, red and green would be considered closer than red and blue because the former two both have similar correlations with the output class apple.
The original VDM algorithm (Stanfill & Waltz, 1986) makes use of feature weights that are not included in the above equations, and some variants of VDM (Cost & Salzberg, 1993; Rachlin et al., 1994; Domingos, 1995) have used alternate weighting schemes. As discussed earlier, the new distance functions presented in this paper are independent of such schemes and can in most cases make use of similar enhancements.
One problem with the formulas presented above is that they do not define what should be done when a value appears in a new input vector that never appeared in the training set. If attribute a never has value x in any instance in the training set, then Na,x,c for all c will be 0, and Na,x (which is the sum of Na,x,c over all classes) will also be 0. In such cases Pa,x,c = 0/0, which is undefined. For nominal attributes, there is no way to know what the probability should be for such a value, since there is no inherent ordering to the values. In this paper we assign Pa,x,c the default value of 0 in such cases (though it is also possible to let Pa,x,c = 1/C, where C is the number of output classes, since the sum of Pa,x,c for c = 1..C is always 1.0).
If this distance function is used directly on continuous attributes, the values can all potentially be unique, in which case Na,x is 1 for every value x, and Na,x,c is 1 for one value of c and 0 for all others for a given value x. In addition, new vectors are likely to have unique values, resulting in the division by zero problem above. Even if the value of 0 is substituted for 0/0, the resulting distance measurement is nearly useless.
Even if all values are not unique, there are often enough different values for a continuous attribute that the statistical sample is unreliably small for each value, and the distance measure is still untrustworthy. Because of these problems, it is inappropriate to use the VDM directly on continuous attributes.
One approach to the problem of using VDM on continuous attributes is discretization (Lebowitz, 1985; Schlimmer, 1987; Ventura, 1995). Some models that have used the VDM or variants of it (Cost & Salzberg, 1993; Rachlin et al., 1994; Mohri & Tanaka, 1994) have discretized continuous attributes into a somewhat arbitrary number of discrete ranges, and then treated these values as nominal (discrete unordered) values. This method has the advantage of generating a large enough statistical sample for each nominal value that the P values have some significance. However, discretization can lose much of the important information available in the continuous values. For example, two values in the same discretized range are considered equal even if they are on opposite ends of the range. Such effects can reduce generalization accuracy (Ventura & Martinez, 1995).
In this paper we propose three new alternatives, which are presented in the following three sections. Section 3 presents a heterogeneous distance function that uses Euclidean distance for linear attributes and VDM for nominal attributes. This method requires careful attention to the problem of normalization so that neither nominal nor linear attributes are regularly given too much weight.
In Sections 4 and 5 we present two distance functions, the Interpolated Value Difference Metric (IVDM) and the Windowed Value Difference Metric (WVDM), which use discretization to collect statistics and determine values of Pa,x,c for continuous values occurring in the training set instances, but then retain the continuous values for later use. During generalization, the value of Pa,y,c for a continuous value y is interpolated between two other values of P, namely, Pa,x1,c and Pa,x2,c, where x1 <= y <= x2. IVDM and WVDM are essentially different techniques for doing a nonparametric probability density estimation (Tapia & Thompson, 1978) to determine the values of P for each class. A generic version of the VDM algorithm, called the discretized value difference metric (DVDM) is used for comparisons with the two new algorithms.
Return to Contents
Send comments to randy@axon.cs.byu.edu